Which Animals to Assess
To understand how to select an appropriate number of sample animals to use to assess a particular herd, it is important to first understand what the goal of sampling is.
Goal:
- To accurately estimate the prevalence of a problem in the herd as a whole
- To target the population that is at risk for that particular problem
Here's an example of how these goals could impact your sample size:
Task: You want to get an idea of how prevalent lameness is on a 5,000-cow dairy farm.
- You need to pick an appropriate sample size based on the size of the herd, and the problem you're assessing for. For example, you cannot score only 5 cows out of 5,000 because the results will not apply to the farm as a whole--if all 5 cows happen to be lame, that likely does not mean that the entire herd is lame. Moreover, severely lame cows only make up 8% of herds, meaning you need to sample more than 5 cows to find evidence of this on a 5,000-cow farm. Rare conditions are harder to accurately capture when you use sample sizes that are inappropriately small.
- Your at-risk population for lameness would be your high-producing cows, old cows, and the cows in your sick pens. This means that if you took a sample of your calves and assessed them for lameness, you would not get accurate results that could be applied to your farm, as calves are far less likely to become lame.
For many of the measures described in this website, you do not need to score every animal in the herd for an accurate assessment. Instead, a sub-sampling method can be used to provide a representative sample for the age group or herd in question. Here are three common methods of sampling :
Random Sample
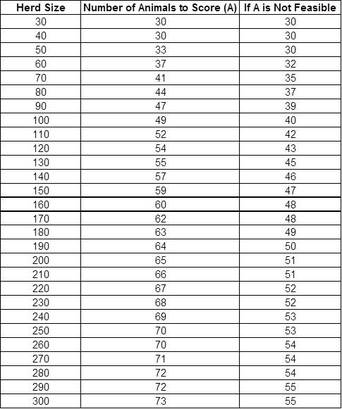
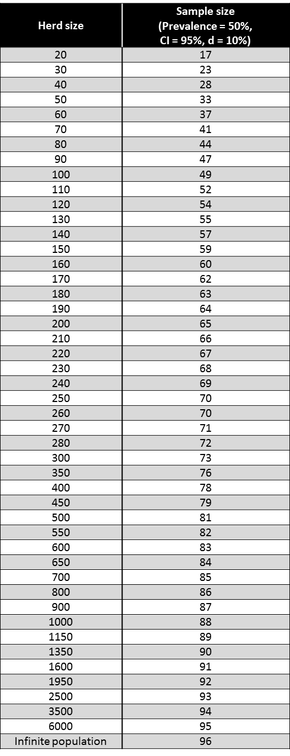
Walk into a pen and choose animals, at random, to score. Welfare Quality® suggests sample sizes that should be used depending on the size of the herd:
The most common problem with this method is that it can introduce bias because it is very difficult to take a sample that is truly random. For example, you may be more drawn to the cows that are standing, and are thus more easily accessible to you. By "randomly" choosing these cows though, you would be skewing your sample against lame cows, which spend more time lying down than sound ones.
Every 2nd (3rd, etc.) Cow
All cows in a pen are locked into headgates and every 2nd (or 3rd, 4th, etc.) cow is scored.
This method eliminates the bias described in the random sample, but requires specific facilities (i.e. pens with headgates).
This method eliminates the bias described in the random sample, but requires specific facilities (i.e. pens with headgates).
Dairy Well Recommended Sampling Method
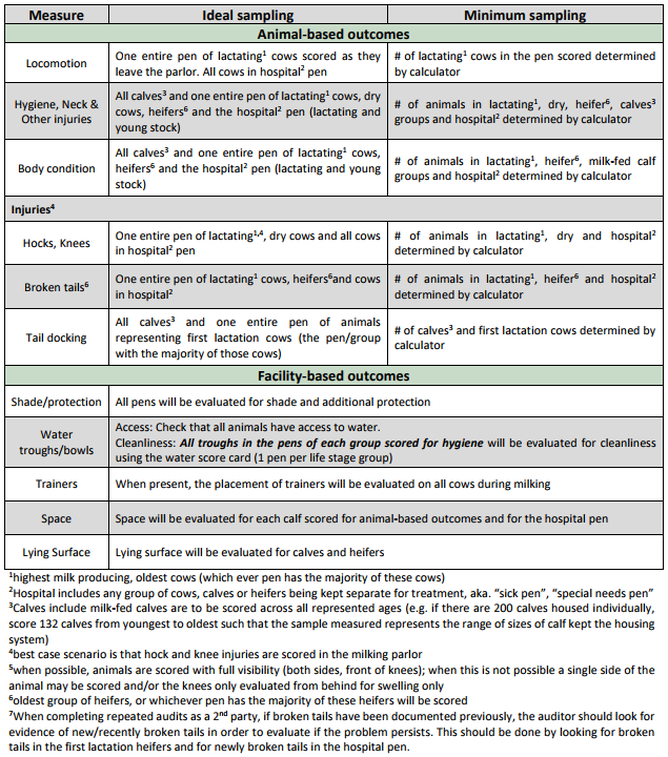
Groups to Score
©Dairy Well 2017
Additional measures not included in the above chart, including dehydration, do not have a required sample size. Instead, any animals in hospital pens will be assessed to ensure that they have adequate access to food and water.
Determining Sample Size
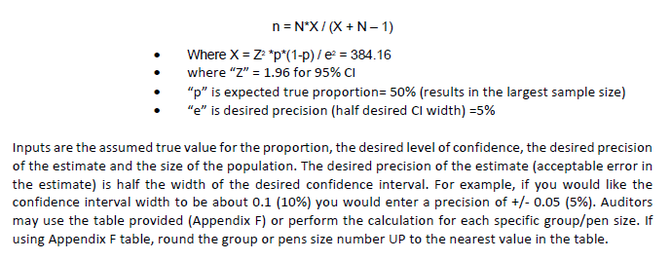
Sample size is calculated for each individual pen scored, not for the total population.
©Dairy Well 2017
National Dairy FARM Program Recommended Sampling Method
Groups to Score
- All classes of cattle for hygiene and body condition
- Only lactating and dry cows for lameness and hock injuries
Determining Sample Size
- Identify the total number of animals on the farm.
- Calculate what percentage of the total herd each group (e.g. lactating cows, dry cows, calves, heifers) makes up.
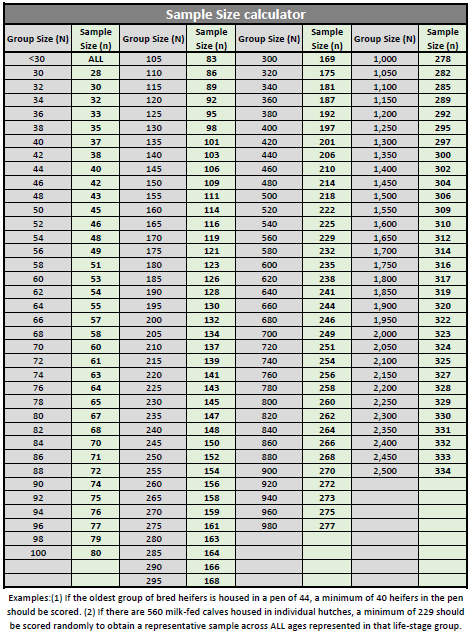
- Use the Herd Sample Size Chart (below) to determine what sample size is required for the total number of animals on the farm. For example, a 500 cattle herd requires a sample of at least 81 animals, while a herd of 1,000 would require at least 96.
- Out of the sample size required, determine how many observations of each group is required based on the overall percentage of the herd it makes up. For example, a 300-cattle herd, as broken down in the table below, would require at least 73 observations spread out across the herd. All calculated percentages are rounded up, giving a total of 74 required samples based on the herd breakdown at this farm.
Sample size determination and distribution based on herd breakdown for a 300-cattle farm.
Herd Sample Size Chart ©FARM 2016

